The Secret Ratio That Predicts Winning Stocks Time and Again
Ever wonder how the most successful investors do it, correctly calling stock picks time and again?
They must know something you don’t, you think, something that gives them that extra edge. Well, you’re right. And it’s easier than you think.
#-ad_banner-#One of the least discussed — but most important — tenets of investing is a handy acronym known as GARP, or Growth at a Reasonable Price. That connotes a company with strong earnings growth, but a share price that isn’t very expensive. In fact, there’s even a handy way to find out if a stock is a true GARP investment. With a bit of math and a little-known ratio, you can come up with a figure that spells it out — then you can invest like the big boys.
That ratio is known as the PEG ratio, which is actually a pair of ratios matched together — the price/earnings ratio (P/E) divided by the earnings growth rate (G). The P/E ratio is a stock price divided by earnings per share. You can use a prior year P/E (trailing 12 months) or a future year P/E (forward). The earnings growth rate is the rate that annual earnings are growing, on a percentage basis, from one year to the next.
To understand, let’s look at two companies, Tortoise Corp. and Hare Industries. Tortoise manages to grow at a modest pace every year while Hare is in the midst of much more robust growth.
While both of these companies earned $2 a share last year, the profits of Hare are growing so quickly that they are likely to be vastly higher in several years, perhaps exceeding $3 a share. Tortoise, with its more dowdy profit growth rate, likely will earn only $2.25 or $2.50 a share in several years.
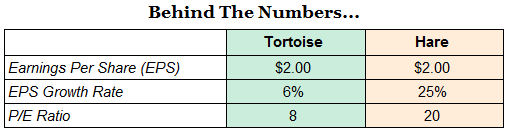
In this example, Hare Industries is actually the better bargain, despite the much higher P/E ratio. That’s because its PEG ratio is more attractive. In this instance, the PEG ratio for Hare Industries is 0.8 (or 20 / 25). For Tortoise Corp., the figure is 1.33 (8 / 6). When it comes to PEG ratios, the lower the better.
In fact, you really want to focus your stock research on companies that can first show that they have a PEG ratio below 1.0. In effect, the P/E ratio should always be lower than the earnings growth rate.
Exceptions to the rule
There are a few notable exceptions to this rule. A handful of companies possess real strengths that you can’t simply measure on an income statement. These are intangibles, such as a company’s brand, that can be worth as much as a company’s income streams. Take Coca-Cola (NYSE: KO) as an example. The beverage maker earned $1.28 a share in 2007 and is expected to earn around $2.20 a share in 2013. That works out to be around 10% annual earnings per share growth. Yet Coke’s shares have always sported a forward P/E ratio of around 15 or 16, equating to a PEG ratio of around 1.5. Why the premium valuation? Because Coke’s brands are so powerful that they are worth billions of dollars by themselves, regardless of the actual earnings they produce.
Other powerful brands that traditionally merit such a premium valuation include McDonald’s (NYSE: MCD), American Express (NYSE: AXP) and Verizon (NYSE: VZ). Yet these are exceptions to the rule. Most stocks are judged by the PEG ratio. Perhaps not explicitly, but investors tend to consider only stocks that look like a solid bargain in relation to their earnings growth rate.
No profits? Look to the future.
Of course, many young and growing companies don’t yet possess robust earnings streams and thus sport very high P/E ratios and therefore very high PEG ratios. For these companies, you’ll have to do some basic math to develop a sense of what the company’s profits will look like well down the road. For example, software provider Salesforce.com (NYSE: CRM) seems quite expensive right now, with 2013 earnings projected to grow 33% to around $2 a share, while the forward P/E multiple is 83. That works out to be a PEG ratio of 2.5.
Yet analysts have looked out several years and figured that this company’s earnings per share could approach $4 by mid-decade. Still, the stock trades at more than 40 times that figure, implying a PEG ratio still above 1.0 (40 / 33). (Note that P/E ratios can be applied to past or future earnings.) So it’s hard to call this stock a bargain, now nor in the future.
Salesforce.com highlights ones of the biggest risks facing investors. They often bid shares of a hot company such as Netflix (Nasdaq: NFLX) or Chipotle Mexican Grill (NYSE: CMG) up to nosebleed heights simply because it appears these companies can do no wrong. When they do finally stumble, investors suddenly take note of a very high PEG ratio and toss these stocks aside. It’s no coincidence that both Netflix and Chipotle eventually tumbled by more than $100 once their momentum faded. History says beware of companies that can’t deliver a healthy PEG.
Action to Take –> As we enter 2013, conduct a PEG ratio analysis on your favorite stocks. In coming weeks, analysts will issue their first estimate of what 2014 profits will look like for the companies they cover. That will help lay out a natural progression from 2011 and 2012 historical profits to the projected profits of 2013 and 2014. You can gauge the rate of earnings growth and then see how that compares to the P/E ratio. Any stock that sports a PEG ratio below 1.0 is worthy of further research.