I’ve Found 13 Undervalued Stocks With At Least 20% Upside…
If you’ve been on the hunt for value in this surging market, then you might like this…
Just recently, I shared a stock screen that I ran with readers of my premium newsletter, Top Stock Advisor. I’m going to make this a regular, reoccurring feature of their subscription as a sort of “bonus” — and I may share these with StreetAuthority Daily readers from time to time as well.
| —Recommended Link— |
| Just Released… THE LIST: Top 7 Growth Stocks To Buy Now Our annual research has produced winners of 310%, 452%, and even 569% in years past. Last year’s picks are beating the S&P 500 3-to-1. And this year’s report could be the most profitable yet… If you’re tired of paltry gains, then this could be the most important thing you read all year. Click here to see it. |
I’ve decided to start with a value screen — meaning stocks that are trading at a discount relative to its fundamentals.
P/E Ratios: How They Work
To kick start our value screen, we will use a stock’s price-to-earnings (P/E) ratio. As most investors know, the P/E ratio compares a stock’s price to its earnings. If a stock sells for $20 a share and its annual earnings amount to $2 a share, the stock sports a P/E of 10. That means it will take 10 years for the company to earn what investors paid for it (assuming earnings stay at $2 a share).
#-ad_banner-#Usually investors will pay more for stocks whose earnings are expected to grow at a fast clip since they believe these stocks will more quickly return their original investment. As a result, high-growth stocks with strong earnings potential generally trade at higher P/E multiples.
Figuring out appropriate P/E multiples is more an art than a science. One way is to compare a stock’s P/E to the market’s average. For instance, the S&P 500 Index, a proxy for the market, is now trading at a P/E of about 25 times the latest 12 months’ earnings. Stocks trading above that may be considered pricey.
However, sometimes comparing a stock’s P/E ratio to the S&P 500 doesn’t provide a clear picture. So comparing a stock’s P/E to its historical average or to that of its industry can help you determine where the stock stands among its peers. This can often help paint a better picture of the stock’s valuation.
Typically, P/E (sometimes called “trailing” P/E) refers to the current price relative to a company’s last 12 months of earnings. But forward P/E, which looks at next year’s forecasted earnings, is also a useful number. In addition, it’s important to consider company growth rates as well. Even though its P/E may be a bit high, a stock trading at a lower price than its one-year earnings growth rate may be a bargain, all other things considered.
Stocks with low P/E ratios may have room to move higher, but P/E’s alone don’t tell the whole story. With a P/E of 6.4, Bed Bath & Beyond (BBBY) is trading far below average. It’s trading for well below its historical average (and all-time low), and trading at a discount to industry competitors. But the stock is no bargain. Sales are flat, gross and net margins have shrunk over the years, and the company is facing stiff headwinds from competitors. Some investors might call this stock a “value trap” because its surface valuations look so appealing, but digging a little deeper you’ll realize that growth outlooks for the company are dim.
In searching for undervalued stocks with low P/E ratios, we have to be careful to bypass companies like Bed Bath & Beyond. In this screen I focused stocks trading at a multiple no higher than the market’s average P/E of 25 but no lower than a P/E of 10.
Additional Screening Criteria
I also weeded out stocks by looking for companies with an enterprise value (EV) to earnings before interest, taxes, depreciation and amortization (EBITDA) of less than 12. I also wanted companies that weren’t saddled with debt they couldn’t pay, so they had to have a cash ratio of at least 1.5. I also wanted companies with profit margins over 18%.
After all was said and done, I was left with only 13 stocks out of a universe of more than 7,000. These stocks all have the potential to return 20%-plus over the next 12 months. That’s based on the current price of shares compared with future sales, earnings and free cash flow projections.
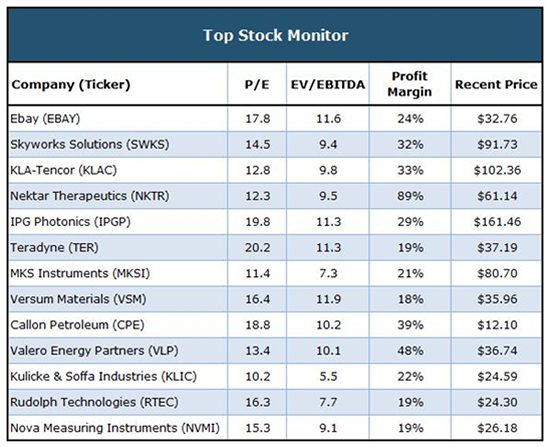
Looking at the results, there are a couple notable candidates that merit further research…
One that sticks out is Ebay (Nasdaq: EBAY). The company has made strides to compete with the likes of Amazon (Nasdaq: AMZN), and it seems to be paying off. After stagnant revenue growth, the company grew sales 6.5% in 2017 over 2016. And Ebay has continued to build off that momentum, as 2018 is on track to post its first double-digit sales growth since 2012. The stock is trading for 3.4 times sales, which is slightly below its five-year average of 3.5.
At current valuations, coupled with growing sales, shares of Ebay could see a 34% return in the next 12 months.
Another interesting candidate from the list is Nektar Therapeutics (Nasdaq: NKTR). The biopharmaceutical company has a handful of drug developments in the immuno-oncology marketplace with its lead candidate being NKTR-214 — a drug that stimulates a cancer patient’s own immune system to fight cancer.
The company is in partnership with a number of large biotech firms including Bristol-Myers Squibb (NYSE: BMY) and Merck (NYSE: MRK). Sales went from $165 million in 2016 to $308 million in 2017, and through the first six months of 2018 the company has already pulled in $1.1 billion — three times what it made all of last year. Its P/E of 12.3 is well below the industry average of 20.4 and its price-to-sales ratio of 7.5 is trading at a 52% discount to its 5-year average. Based on current valuations, shares of Nektar are trading at a 37% discount to fair value.
Please keep in mind that the investing ideas presented here are intended to provide a good starting point for further research. As with any quantitative tool, this stock screen should not be used in isolation. You need to evaluate other fundamental characteristics of every potential investment opportunity to determine if it is right for your portfolio.
That said, if you’d like to research these stocks further on your own, you’re free to do so. But in order to gain access to my top picks, you should consider giving my premium Top Stock Advisor service a risk-free trial. We’re also offering our latest report — 7 Legacy Assets to Own Forever — at absolutely no additional cost. To learn more about this report, go here.