These Metrics Help Me Know If It’s Time To Sell…
Like most investors, I’ve grappled with the decision of whether or not to sell a longtime holding. After all, as I discussed in this article, it’s one of the hardest decisions an investor has to face.
Well, I recently made that decision with two stocks over at my premium service, Top Stock Advisor.
The reasoning? It’s because of the third tip I discussed in my earlier article: sky-high valuations.
It’s this point that I want to spend a little time on today, because it’s so important. After all, how do you know when a stock is “overvalued”?
I touched on this conundrum a bit in my previous article. Here’s what I said about the challenge of looking at a stock’s valuation:
It can be a bit tricky to base a sell decision on valuation metrics alone. If the company backs up the lofty valuations with outstanding sales and earnings when it reports next, then those valuations might not seem so lofty.
But if you’re not feeling overly confident about the stock’s prospects then it’s okay to book your profits (or cut your losses), or even trim back on the position a little. In other words, it’s okay to take some profits off the table.
After all, if we’re not constantly injecting cash into our brokerage account, then we need to raise cash somehow. Taking profits, or rebalancing the portfolio, is a great way to do that.
So with this in mind, I want to walk you through what I look for when determining a stock’s value. I’ve found that the metrics I’m about to mention today to be important factors when considering the nature of “value” – and whether to sell, cut my position, or double down and buy more.
Hopefully, this will help guide you in your own decision-making process…
Overvalued On Just About Every Metric I Watch
The first stock we sold is longtime holding, PayPal (Nasdaq: PYPL).
I first recommended PayPal in my April 2017 issue. Not only was it a play on my “end of cash” theory, it was a pioneer in the space. Its mobile payments segment was booming, it owns the popular money transferring app Venmo, and was (and still is) the dominant force in the industry.
It’s been one of my best recommendations over the years. The stock is up almost 300% in just over three years, crushing the S&P 500’s return over the same period.
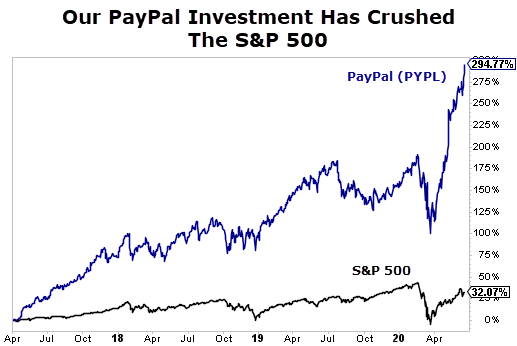
As you can see, shares initially fell in March from the coronavirus pandemic. But the stock has skyrocketed since then. And right now, the stock is trading at a rich premium.
When I first recommended PYPL in 2017, we paid about 37 times earnings, and 4.7x for every $1 in sales. It had an enterprise value to free cash flow multiple of 19. While those on their own were lofty valuations at the time, I believed the company’s future growth supported paying that much for it.
And it did… but now it’s trading at ridiculously high valuations.
Right now, shares are trading at a P/E multiple of about 104. That’s more than double the stock’s historical five-year average of 49.
Investors buying PayPal today are paying nearly 11x for every $1 in sales. Again, this is much higher than its historical average of 6.7. And its price to free cash flow is just over 26.
Now, don’t get me wrong, I like PayPal. It’s enjoying great success with the surge in online shoppers and its contactless selling and purchasing option. But there’s not a single valuation metric that you can look at that shows the stock is trading anywhere close to what I would deem a “fair” value for the company.
But at this point, it’s just too rich for my blood. So that’s why I went ahead and booked my profits.
Different Stock, Same Story
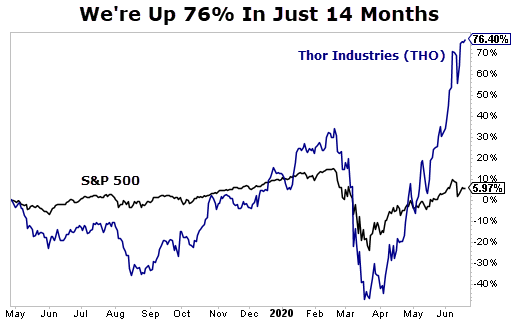
The story is similar with the recreational vehicle manufacturer Thor Industries (NYSE: THO). I think the stock has some good tailwinds behind it, and I think folks will likely be staying closer to home and camping this summer, but shares are trading at a premium.
We’ve only been in this trade for just over a year, and while it was a wild ride, we are up more than 75%.
Right now, shares of Thor are trading at a P/E multiple of 32.2. That’s nearly double its five-year historical average of 16.7. Its enterprise value to earnings before interest, taxes, depreciation, and amortization, or “EV/EBITDA”, is 14 now, also above its five-year historical average of 8.9.
We paid around 15 times earnings when I recommended the stock last spring, and its EV/EBITDA multiple was just 6.5.
We may see more profits ahead for the stock. But when you get a 76% return in just over a year from a consumer cyclical stock like Thor, you take it. The market earned about 6% over the same time frame, and the stock is trading at its highest point in the last five years from a valuation standpoint. So it’s not a bad time to take profits and move on.
Action To Take
While there are no perfect solutions and no one metric should be considered in isolation, there is a bit of intuition you have to exercise once you get past the numbers. Buffett famously says price is what you pay, value is what you get.
But hopefully this gives you an understanding of my thought process when I look at various valuation metrics. Should either of these stocks sell off for some reason in the future and I see another opportunity to get back in, I won’t hesitate. But until then, I’m moving on.
In the meantime, I highly encourage you to check out my latest research.
It could easily be our most profitable opportunity in years…
You see, I recently spotted something curious. It was buried deep in the SEC filings of a little-known satellite technology company. And the implications are huge…
Chances to beat Wall Street insiders don’t come along every day. So, it’s critical you jump on this one immediately. Go here to learn more…