3 Technical Levels To Watch + 2 Trades To Make Right Now
The next week will be an interesting week in the stock market. Of course, there’s never any shortage of events that could change the outlook for the market one way or another… But according to a chart of the S&P 500, it looks like we’re at an important technical resistance level.
Resistance is an important technical term for a price level where a security’s advance is expected to stall. In other words, it’s a price level where sellers appear, and their actions can often be anticipated.
In the chart below, I’ve labeled three factors that are all pointing toward resistance near the S&P 500’s current level around 2,600…
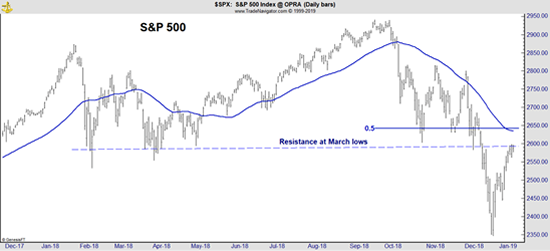
1. The March lows (blue dashed line): Many investors like to buy stocks when they approach previous lows, as it often represents a “safe” bargain price. We saw this in action back in October and November, when stocks fell to their March lows (which then represented “support”) and were met with aggressive buying. However, stocks suffered a rapid loss in December, so anyone who bought at last year’s lows is just getting back to even. From what I’ve observed, many traders tend to sell the moment their positions get back to break even (call it “breakevenitis”), which means we’re likely to see a fair amount of selling as we approach this resistance level.
2. The 50-day moving average (solid blue line): This short-term MA is also likely to offer resistance. Many traders watch this moving average and will expect resistance when prices rise to that level. That makes the MA a self-fulfilling prophecy to some degree.
3. The 50% retracement (blue line marked 0.5): This is a retracement of the October-to-December decline. Like moving averages, retracement lines are popular technical levels among traders, and they can also become a sort of self-fulfilling prophecy at times. In this specific case, the retracement line also coincides nicely with the 50-day MA.
With multiple resistance points collected around the same level, prices could stall here for some time… unless a catalyst arrives to force a breakout.
I believe the 31 major earnings reports due out over the next week will provide that catalyst. Major financials including Citigroup, Goldman Sachs, and Bank of America will all report, offering insight into consumer spending and financial markets. Railroads will also report, providing detailed insights on the economy.
PAM Turns Up, Confirms Bullish Technicals
The next chart shows daily prices for the S&P 500 index with its 200-day MA and my Profit Amplifier Momentum (PAM) indicator added at the bottom.

PAM turned bullish and that confirms that the stock market is likely to rally. The near-term target in the S&P 500 is about 2,790. That’s the next important resistance level on the chart, and it is more than 8.5% above recent levels.
That’s a significant potential gain and risk can be relatively low for traders.
A move 3% below Friday’s close would indicate that the expected “up” move is unlikely to materialize. However, the risks of a sudden “down” move — driven by news related to one of the crises in Washington and capitals around the world — could lead to an opening gap much larger than 3%. In this environment, stops cannot be relied upon to limit losses.
This Week, I’m Looking At SPY And GLD Calls
This means call options — which are a key part of our strategy over at Profit Amplifier — remain the best way for very short-term traders to benefit from the major stock market averages for now. And I’m seeing a lot of potential in a specific call on the SPDR S&P 500 ETF (NYSE: SPY).
Currently, the SPY Feb-22 259 Calls are trading around $7. (That’s a call option on SPY with a strike price of $259 that expires on February 22, 2019.) I think this call is attractive for any price around $7. Since a contract covers 100 shares, the trade would cost $700 to open. That is also the maximum possible loss. (When buying a call, the trader can only lose the amount paid for the call. The loss is limited and can never be more than that.)
If SPY rallies to its potential target near $279, the option would be worth at least $20, offering a large potential gain of more than 185%.
If you take this trade, consider using a trailing stop or taking partial profits if the market rallies as expected.
Another market for short-term traders to consider is gold. The chart of SPDR Gold Trust (NYSE: GLD) is shown below.
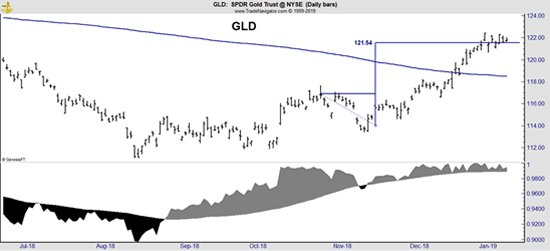
The ETF has been consolidating after reaching its short-term price target, and PAM remains bullish.
I am not a fan of owning GLD directly because it is taxed like an investment in gold bullion or collectibles rather than as a stock. But call options avoid that concern. Specifically, I like the GLD Mar 121 Call for about $2.75. (That’s a call option on GLD with a strike price of $121 that expires on March 15, 2019.)
This option could double in the next two months.
An Invitation To Trade With Me
Remember, these are not official Profit Amplifier trades — they’re merely suggestions for those of you who are already familiar with options to try my trading ideas and see if you like them. If you like what you’re getting, then you can consider joining us for more trades at this link.
If you’re not an experienced trader, then you can still learn more about how my strategy works… all it takes is a few minutes of your time. In Profit Amplifier, we use a simple options strategy to profit from even the smallest moves in either direction — making far more than investors who simply buy and sell stocks. In fact, we’ve closed a number of triple-digit gains in the last two months. To learn more, go here.