The Shortcut To See How Much Your Portfolio REALLY Returned
If you’ve ever taken a road trip, you know there are usually two ways to get to a place: the boring interstate way and the “scenic” route.
The first option is usually pretty much a straight line between point A and point B; the second option inevitably involves a windy road, less traffic, some sort of awesome restaurant and hours of nerve-wracking stress when you get lost or need to pee. But regardless of which route you take, you’re going to start at point A and end up at point B. The two trips have the same beginning and ending.
That’s an important idea to remember when thinking about the compounded annual growth rate (CAGR) calculation. Put simply, CAGR is a return measure that represents the annual growth rate of an investment for a specific period of time.
The formula for CAGR is:
CAGR = (EV/BV) ^ (1 / n) – 1
where:
EV = The investment’s ending value
BV = The investment’s beginning value
n = Years
In broad terms, when you invest in something, you always take the scenic route, but you use CAGR to see the interstate-route equivalent. So, for example, let’s assume you invest $1,000 in the Company XYZ mutual fund, and over the next five years, the portfolio looks like the chart below.
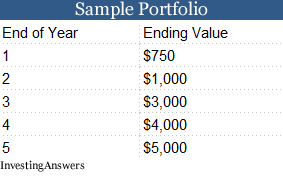
Using this information and the formula above, we can calculate that the CAGR for the investment is:
CAGR = ($5,000/$1,000) ^ (1 / 5) – 1 = 0.37972 = 37.97%
The math is pretty simple. What can be difficult is understanding why CAGR is important and why so many investment advisors use it.
That gets us back to our road trip…
The year-by-year performance in your portfolio is the windy road. Just look at the first two years of your five-year investment in the Company XYZ mutual fund. By the end of the first year, you lost 25% of your money: The portfolio fell in value from the original $1,000 to $750 for a return of ($750 – $1,000) / $1,000 = -25%. That’s like hitting construction on Interstate 5 in Los Angeles. Gulp.#-ad_banner-#
Then, from year one to year two, the portfolio grew, this time by ($1,000 – $750) / $750 = 33%. Woo hoo! Making good time!
Averaging these returns over two years gives us (-25 + 33)/2 = 4%, but that doesn’t accurately reflect what happened, because you began with $1,000 and ended with $1,000 during those two years. The return over two years wasn’t 4%, it was zero! It was just like making good time after getting through a two-hour construction delay — your investment may have had a good year, but you’re not really ahead of the game.
That’s the trouble with a lot of investments: They usually don’t supply an even rate of return every year. Some years, the investment is up 33%, some years it’s down 25%, and the next year maybe it just lays there. You don’t get the same exact return year after year after year. Some years are good, and some years aren’t.
And let’s remember: Compounding is the process of earning returns on an initial investment (your $1,000) plus any returns on that investment that you already earned.
So if this investment were a dividend stock that was in a dividend reinvestment plan, for example, your account would be credited for a fraction of the shares covered by your dividend payments every quarter, and then you’d have more and more shares riding in the market over time. That could make a huge difference in how high those highs feel and how low those lows feel.
That’s why calculating annual performance is the windy road. CAGR is the freeway. CAGR looks at the beginning and end value of your investment and figures out what steady-Eddie, annually compounded rate of return would have gotten you to the same place.
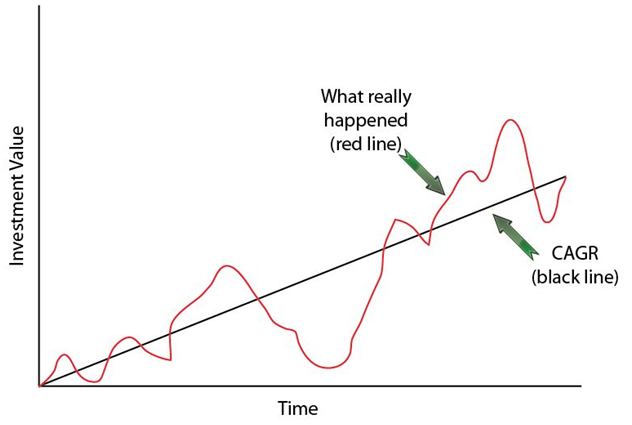
As you can see, you start and end in the same place. Sure, your investment was volatile and went up and down like a bad roller coaster, but as our math example shows, in the end it was the same as investing in something that paid you 37.97% per year.
A lot of investment advisors will tell you they’ve produced a “10% compounded annual return” for their clients, or somebody might be trying to get you into an investment that could have an “X% compounded annual growth rate.” That’s usually the best way to present it. Although average annual return is a common measure for mutual funds, CAGR is a better measure of return over time. Average annual return ignores the effects of compounding and it overestimates the growth of an investment.
That one awesome year, for example, will totally outweigh the 50 other years of bad returns if you just average each individual year’s returns. CAGR, on the other hand, is a geometric average that represents the one, consistent rate at which the investment would have grown if the investment had appreciated at the same rate each year.
Action to Take –> Whenever you’re evaluating someone’s claims about returns on an investment, take a moment and ask how the returns are calculated. If the claims are posted on a website, look through the footnotes and fine print to see what the calculation method is.
As we’ve shown you, there’s more than one way to skin a cat, and the difference in method can result in wildly different claims about the same investment. The compounded annual growth rate is one of the most reasonable, but it’s not the only way.
This article originally appeared on InvestingAnswers.com:
The Shortcut To See How Much Your Portfolio REALLY Returned