A Peek Into A Top Value Investor’s Latest Moves
Using the wrong words can be dangerous. Confuse “sapo” for “sopa” in Spain, for instance, and you’re going to get a frog instead of soup. Fail to listen to the Rolling Stones song “Beast of Burden” closely, and your friends will be howling when you croon, “I’ll never leave your pizza burnin’.”#-ad_banner-#
In the bond world, the stakes are even higher. As with any investment, words are all you have to help you understand what you’re buying and what the risks are.
Here are two of the most confusing yet most fundamental. Make sure you understand what they mean before your next foray into the market.
Yield to Maturity (YTM)
Yield to maturity is one of the most misunderstood bond terms because it involves math that looks hard. But don’t let it faze you.
First of all, the math isn’t that hard, and today’s spreadsheets and financial calculators do it for you.
Second, the math isn’t the point. Here’s the point: YTM is just the annual return (or average annual profit) you’d receive if you held a bond until maturity.
But we’re showing you the math anyway. To get through the next paragraph, just remember this: The price of a bond has to equal to the present value of its future cash flows. That’s all the YTM formula is saying.

where:
P = price of the bond
n = number of periods
C = coupon payment
r = required rate of return on this investment
F = maturity value
t = time period when payment is to be received
To calculate YTM, you use trial and error (but more likely a financial calculator or software) to find out what percentage rate (r) makes the present value of the bond’s cash flows equal to today’s selling price. You’re trying to find out what required rate of return the market is using to calculate the price of the bond.
For example, let’s assume you own a 5% Company XYZ bond with a $1,000 par value that matures in three years. If this bond is $980 today on the market, we can calculate that the YTM is 2.87%. Because the coupon payments are semiannual, this is the YTM for six months. To annualize the rate, we simply use this formula:
Effective Annual Yield = (1 + Periodic Interest Rate) payments per year – 1
= (1 + .0287)2 -1
= 5.82%
YTM helps you comparison-shop because it helps you determine whether something like a 10-year bond with a high yield is better than a five-year bond with a high coupon, and it highlights something people almost always fail to understand when they’re moving money in or out of bonds: When bond prices fall, yields rise; and as bond prices rise, yields fall.
Yield Curve
A yield curve plots the yields of similar-quality bonds against their maturities, ranging from shortest to longest. Here’s where people get confused: The chart doesn’t plot coupon rates against a range of maturities — that’s called a spot curve. The yield curve chart plots yields against maturities.
There are three main types of yield curves. If short-term yields are lower than long-term yields, the curve is called a positive (or “normal”) yield curve. If short-term yields are higher than long-term yields, the curve is inverted (or “negative”). A flat curve exists when there is little or no difference between short- and long-term yields. Here’s what a positive yield curve looks like:
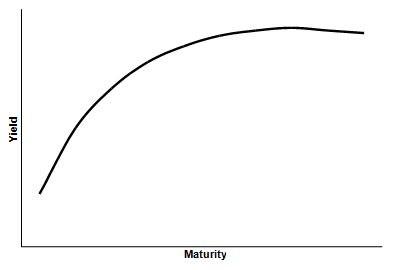
People try to use the yield curve as a crystal ball. Generally, a positive yield curve indicates that investors require higher returns for taking the added risk of lending money for a longer period of time. Many economists also believe that a steep positive curve indicates investors expect higher future inflation (and thus higher interest rates), and that a sharply inverted yield curve means investors expect lower inflation (and interest rates). A flat curve generally indicates investors are unsure about future economic growth.
In the 1990s, Duke University professor Campbell Harvey found that inverted yield curves had preceded the five previous U.S. recessions.
Action to Take –> It’s advice as old as the sun is hot: Understand what you’re doing before you invest. In the bond world, the terms in this article are just two of the many you should know well before you make any moves. From them, we learn many lessons: There is a way to compare bonds of different maturities and coupon rates; when interest rates rise, bond prices fall; and yield curves are like mood rings.
This article originally appeared on InvestingAnswers.com
A ‘Crystal Ball’ For Stocks And Bonds?
P.S. — Looking for something a little simpler? StreetAuthority’s Amy Calistri has one objective for readers of Stock of the Month: to provide one quality stock pick each month, with in-depth analysis in plain English that investors can understand. In fact, she just released a special presentation, “How to Beat the Stock Market… In Just 12 Minutes per Month,” that tells you more about her strategy. Go here to learn more.