A Reliable Signal a Price Move is Coming
Dojis are single candlesticks where the open and close are the same or very close together. This price action makes the body of the candle look like a horizontal line. The length of the wicks will vary, and that can offer a clue as to whether a doji pattern is expected to be bullish or bearish.
There are many variations of dojis. Three common dojis are shown below.

If the open and close are near the middle of the price action, then the doji is sometimes called a Rickshaw Man. This is believed to show a market in balance. Although traders aren’t offered any clues about the future direction of prices, this doji is often thought of as a warning that a big move is likely.
Gravestone dojis look like a gravestone standing up from the ground. They occur when the open and close are near the low of the day. Gravestones are a bearish signal since they show that prices could not hold on to the gains and fell all the way back to the low.
A Dragonfly doji is formed when the open and close are near the high. Although prices move lower as the Dragonfly forms, they rally back to the high at the close, and this is considered bullish.
How Traders Use Dojis
Take a look at the chart of the S&P 500 Index during the summer of 2020 below. On the left, a Rickshaw doji hinted at a possible big move, and the index subsequently rallied before falling again. Moving further into July, we can see three Rickshaws hinting at a coming significant trend. A few days later, we see a Dragonfly signal a major uptrend, which lasted through the rest of the summer.
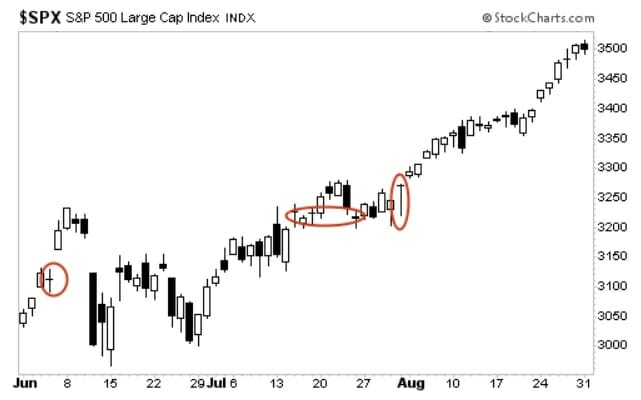
In the three examples shown in the chart, dojis served as signals that tradable market moves were approaching. This pattern can be found in any market and in any time frame.
Why Dojis Matter To Traders
When traders spot dojis, they have a signal that the price action is likely to become more volatile. They can use the candlestick pattern as a trigger to do more research. By analyzing momentum, a trader may be able to identify the probable direction of the breakout. This could allow traders to anticipate momentum signals and enter trades early.
For example, if a Rickshaw Man occurs while the Relative Strength Index (RSI) is rising, the trader could go long even if RSI is below 30, which is commonly used as the value for signaling buys.
P.S. By the time you read about the possibility of a mega-merger in the news, the real action — and the real profits — are long gone.
So how do you go about finding two companies that are about to “tie the knot” before the rest of the world catches on? How do you beat well-funded media conglomerates and slick Wall Street research houses to the punch?
Our colleague Nathan Slaughter does it all the time — allowing his followers the chance to make gains of 135%… 150%… 344%… and more.
Go here now to learn his secret in this brand-new special presentation.