Introducing: The Cash Flow Aristocrats
I couldn’t believe we were hassling over 1/8 of an inch.
It was the fall of 2010 and I was helping my parents build a new addition to their house. I was assisting their contractor with the foundation, and when we measured everything out before we poured the footers and stem walls we were less than 1/8 of an inch off.
| —Sponsored Link— |
| Step 1: Buy These 5 ETFs Now… |
I thought that was pretty good. I mean, who would notice? Plus, it would be covered up in any event…
But the contractor wouldn’t let it go. He wouldn’t be satisfied until we were perfect.
#-ad_banner-#What he taught me that day, I’ve carried over into my financial career.
You see, as you know the foundation is the most important part of any house. And that 1/8-inch mistake compounds and turns into a one-inch gap by the time you get to building the roof. That day I learned that if I take a little more time to make something perfect — measure twice, cut once, if you will — it will make my life, and everyone else’s, much easier going forward.
That very notion holds true in everything you do. If you have a faulty foundation, it doesn’t matter how elegant the house sitting on top is. There will be gaps and holes that will slowly widen over the years and become more apparent.
The One Metric You Should Always Look At
With investing, a small loss can easily turn into a big loss if you don’t act quickly. That’s why when it comes to my Maximum Profit system I want to be sure that the very foundation — the backbone — of my system’s components are rock solid. Taking a shortcut here could cost me, and my readers, dearly in the future.
Now there’s no perfect financial metric to look at when it comes to a company’s financial statements, but there is one that I believe gives the most “honest” outlook for a company. It’s the number that most accurately depicts a business’ economic health. Why? Because it’s the hardest to fake…
Thanks to the way the accounting rules are written, companies can easily “massage” the numbers in categories such as revenue… earnings… and asset values. But cash flow is practically incorruptible and can give you the clearest perspective of how well a company is doing and should continue to do in the future.
For example, investors who looked solely at the cash flow numbers for investment bank Lehman Brothers back in 2003 could have pinpointed exactly when the firm was in trouble… and avoided its disastrous collapse later on.
In the chart below you can see that this company was showing signs of weakness as early as 2003, when its cash flow plummeted from around $6 billion in 2002 to $2.4 billion. Now, one bad year isn’t a reason to write-off any company completely, but it is a cause for concern. During times like these it’s best to wait on the sidelines to see if things get better… but this wasn’t the case for Lehman Brothers.
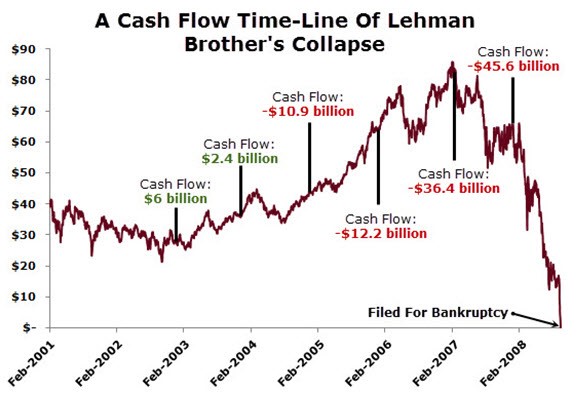
As you can see, things only got worse for the global investment bank — the next year’s cash flow came in at a $10.9 billion loss. And things continued downhill from there, with the company losing more than $45 billion as the housing market fell apart in 2008 and Lehman Brothers was left holding a hodgepodge of worthless mortgage-backed securities.
This is a prime example of how cash flow would have flagged the early warning signs of a company’s impending financial woes.
This is why cash flow forms the foundation to the second component of my system (with relative strength constituting the first). And when used together, they give an important “tell” as to what a stock is about to do next.
Many years ago, when I backtested a number of financial metrics, cash flow always came out on top. In fact, when looking at it by itself, cash flow has greatly outperformed the market. Take a look at the Cash Flow Aristocrats Index I designed below, and discussed in this article, and see for yourself…

This was by far the best metric I tested and provides definitive evidence that using cash flow as the foundation to my second indicator is the most beneficial approach to finding stocks that produce market-beating gains. In fact, cash flow is one of the best metrics of future success I’ve ever come across.
Looking at firms with rising cash flow ensures that my Maximum Profit readers and I are investing in companies with a growing stockpile of ammunition for business expansion. And just as relative strength measures how well a stock is performing against the broader market, my indicator — cash-flow relative strength (CFRS) — works in a similar way. It measures how fast a company’s cash flow is growing relative to the market.
My Cash Flow Aristocrats Index performed so well that I decided to take this index and run it through my Maximum Profit system. Every year I’ll test cash flow to make sure it continues to be fruitful for successful investing. And the results from previous years have continued to prove that cash flow is still one of the best fundamental indicators out there. (This will be the fourth year since this index has gone “live”).
Last year we had a lot of winners, including my top three recommendations. Here’s a look at how my top recommendations performed:
2017 Cash Flow Aristocrats Index
| Company | Total Return(10/3/16 – 10/2/17) |
|---|---|
| S&P Global, Inc. (SPGI) | 27.6% |
| XPO Logistics, Inc. (XPO) | 84.4% |
| Navistar International (NAV) | 69.8% |
Bottom line, if you’re not looking at cash flow when making your investment choices, you may be flying blind. It’s perhaps the single best indicator of a company’s fundamental success.
As I mentioned in my original discussion of the Cash Flow Aristocrats Index, the stocks in this index are rotated every year based on the previous year’s cash flow numbers. And just recently, I shared the names and ticker symbols of next year’s index with my Maximum Profit readers.
Now, I can’t promise this year’s picks will be as profitable as last year’s. But if history is any guide, I’d say we have an excellent opportunity to pick up on a handful of the market’s best-performing stocks going into 2018, and beyond. If you’d like to get your hands on the names of these picks, as well as all of my regular picks in each issue of Maximum Profit, then I invite you to learn more here.