This Popular Trading Tool Is Giving Me A Quick 3.6% Payout
When I study charts, I often add a tool called Fibonacci retracements to the chart. This tool shows how much of a previous price move has been retraced.
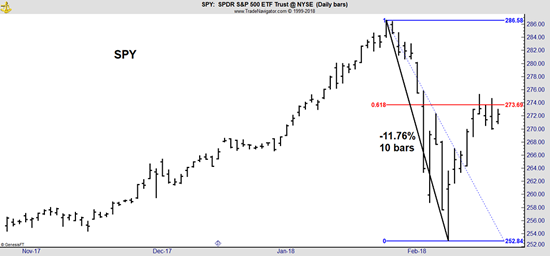
This is a daily chart of the SPDR S&P 500 ETF (NYSE: SPY). In this case, prices fell almost 12%. The subsequent gain of about 8% retraced more than 60% of the loss. Retracements are important to technical analysts and are widely followed by traders at some of the biggest hedge funds. These funds aren’t relying on retracements or Fibonacci ratios to make decisions, but they do provide valuable input into their market opinion.
| —Sponsored Link— |
| The Hottest Crypto Miner On Wall Street |
Technical analysts expect prices to move up and down. This is obvious, but the idea was first explained by Charles Dow in a 1901 article in The Wall Street Journal:
“A person watching the tide coming in and who wishes to know the exact spot which marks the high tide, sets a stick in the sand at the points reached by the incoming waves until the stick reaches a position where the waves do not come up to it, and finally recede enough to show that the tide has turned. This method holds good in watching and determining the flood tide of the stock market.”
This is a nice visual of the stock market. The tide rises and then recedes. Stock prices do the same. Later editorials in the paper would expand on that idea:
“Secondary reactions usually last from three weeks to as many months, during which…the price movement generally retraces from 33 per cent to 66 per cent of the primary price change.”
#-ad_banner-#Later, technical analysts introduced the idea of Fibonacci ratios to describe the retracements. These ratios are 38.2% (about one third), 50% (about halfway between one third and two thirds) and 61.8% (about two thirds).
These are useful because a break above the 61.8% retracement level indicates the likelihood of a new trend. It’s important to remember these are just numbers that are built into software that allow traders to quickly evaluate the market action. There is nothing magical about these numbers (even though some individuals do claim they are magical).
The truth is simply that Bloomberg terminals and many charting websites let traders apply Fibonacci ratios with the click of a mouse, and managers with billions of dollars under management are drawing these lines on their charts. A breakout would indicate the resumption of the uptrend simply because many managers will start investing more aggressively when that happens.
Until we see a decisive breakout, caution is warranted. To proceed cautiously, I am focusing on the short term, applying my conservative options-for-income strategy to trades that expire prior to an earnings announcement, and show strong technicals and fundamentals.
This week, I found all of that.
The Perfect Trade For Uncertain Market
Microsemi (Nasdaq: MSCC) makes analog and mixed-signal semiconductor solutions differentiated by power, security, reliability and performance. The company’s technology is used in devices associated with cardiac care (pacemakers), physiological monitoring (insulin monitoring), pain management (spinal cord stimulators) and obesity treatments (which can also include spinal cord stimulators).
According to a recent report from P&S Research, the market for active implantable devices (which includes pacemakers, defibrillators and neurostimulators) is expected to grow at about 8% per year over the next five years, reaching nearly $29 billion by 2023.
MSCC is already a leader in this industry with revenue of $1.8 billion in the past 12 months. Established products are important because this is an industry with significant barriers to entry. Designing and securing approval of devices can take years and requires billion of dollars in expenses. Companies are not likely to take chances on new entrants into the industry, giving MSCC a solid position that translates to steady growth.
The technical pattern is also bullish, as you can see in the short-term chart below, which shows a successful test of the recent lows.
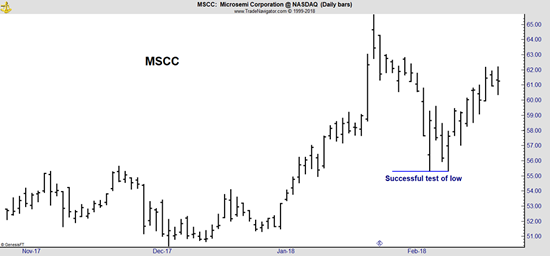
Technical analysts look at a successful test, or a dip back to an earlier low, as a signal that buyers are interested in the company at that price. The drop provides an opportunity for bargain hunters to buy, and that results in the successful test.
The longer-term chart shows that stock is breaking out of an extended base.
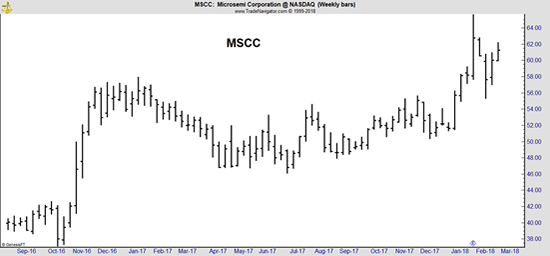
For nearly two years, the stock traded in a narrow range before finally moving higher. This is bullish and indicates there aren’t investors waiting to sell when they have a chance to break even. This is the type of pattern that is appealing to momentum investors.
Finally, Microsemi’s next earnings report isn’t expected until the end of April. That means choosing an option expiring in March carries little risk of earnings-related news sending the stock sharply lower.
How I’m Trading This Stock — Without Buying A Single Share
If you’re interested in catching some of the potential upside, you can always buy shares of MSCC and wait for April’s (hopefully) positive earnings report.
But I found a better trade… One that will guarantee I collect 3.6% in income in just three weeks. That’s a more-than-comfortable 60.3% annualized. And all without buying a single share of the stock. This trade uses a high-income, short-term put option on MSCC.
Now, I understand not everyone is comfortable selling options, but you shouldn’t let that fear or nervousness keep you from taking advantage of this tool. Because that’s what options are — a tool for traders. They can be as risky or conservative as you want them to be. It all depends on the strategy you’re using.
My strategy is one of the safest around. In fact, I’m making a guarantee to new subscribers to show how low-risk options can be:
If you follow along with my trades and don’t make money at least 90% of the time… I’ll work for you for free. That’s how confident I am.
I recently released a special report that will tell you everything you need to know, including how my readers are making about $568 a week from selling options. There’s even a list of three questions to ask yourself to help determine if you’re ready to trade options. Simply follow this link to check it out.