How Fibonacci Retracements Can Help Time Your Trades
Retracements are price moves that are opposite to the primary trend. In a bull market, retracements are the short declines that interrupt the long-term trend of rising prices. Bear market retracements are short up moves.
While traders usually think of retracements in terms of price, we can also apply this concept to time. Prices spend most of the time rising in a bull market. They will retrace advances over shorter periods of time. The reverse is also true, with shorter bounces in a longer bear market decline.
We usually measure market moves using both price and time. Traders may say that a stock has gone up 15% over the past three weeks. Since prices move both up and down, we would expect the price advance to be partly retraced. And that decline should last for a short period of time in a bull market.
Fibonacci ratios can be applied to either price or time to help define retracements. In either case, the key ratios of 38.2% and 61.8% are significant when looking at a chart. Those levels serve as resistance to price advances in a bear market and offer price support on a decline in a bull market.
For example, if prices fell 100 points, traders would look for a retracement to deliver a gain of about 38 points in a subsequent price bounce. From a time perspective, a retracement following a three-week decline should last six to nine days (38.2% of 15 days is 5.73 days and 61.8% is 9.27).
How Traders Use Fibonacci Retracements (And Why They Matter)
When applied to price, Fibonacci retracement levels should forecast support or resistance levels. An example of price retracements is included in the definition of Fibonacci ratios. When applied to the time scale of a chart, Fibonacci retracements forecast the times when a market reversal is likely to occur.
To apply this idea, traders can measure the amount of time a market takes to move from a low to a high. We simply add Fibonacci ratios to the chart from the time when prices peaked, and important trend reversals should occur on days associated with Fibonacci ratios. If a price advance lasted 100 days, you could expect price reversals to last about 38 and 62 days.
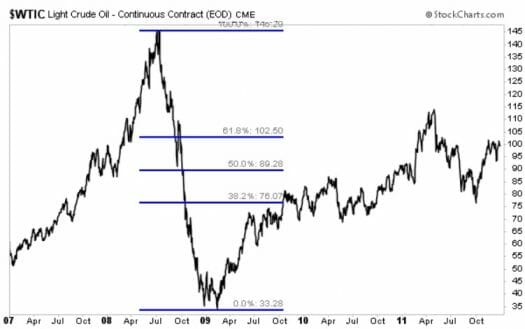
The example below shows the bull market move that pushed crude oil to an all-time high in 2008. The Fibonacci ratios based on price that we discussed previously are shown in the chart.
But traders can also use this ratio applied to time. For example, below is a chart showing a Fibonacci time scale from the time prices reached their peak. Interestingly, prices reached their bottom roughly 55 days after the peak and began rebounding. They hit resistance at around 89 days and remained range-bound until breaking out after 233 days.

Here’s another way traders could look at this… The price advance lasted 78 weeks. The initial decline unfolded over 30 weeks (38% of 78 weeks). Prices resumed their decline 48 weeks (62% of 78 weeks) after the peak.
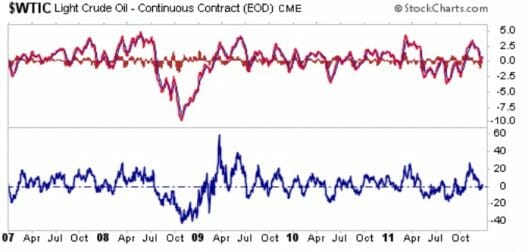
Some detractors may point to the use of Fibonacci numbers and ratios as mere coincidences. While we don’t argue with this necessarily, it’s also interesting to consider that momentum indicators, including the 26-week rate of change (ROC) and Moving Average Convergence/Divergence (MACD), confirmed the price reversals in crude oil.
Closing Thoughts
Traders incorporating Fibonacci retracements based on time or price levels can increase their chances of catching the major market turns. Like many indicators and technical patterns, it’s usually best to rely on multiple tools and not become overly reliant on one. Still, traders have few tools that project precise time targets. That makes Fibonacci retracements a useful addition to the trader’s toolbox.
Knowing a trend change is expected at a certain time can be valuable. Using this knowledge, you can watch other indicators (like momentum) to capture as much of the trend as possible.
P.S. We’ve been telling our readers about a little-known satellite company that just made a game-changing acquisition. And buried in the deal’s details was a stunning revelation that could be worth billions…
Wall Street still hasn’t caught on to the potential, which means early investors could make huge gains once the crowd catches on.
To get a full briefing and learn how you can profit, check out our report right here.