A Simple Yet Effective Indicator For Clear Buy And Sell Signals
The Moving Average Convergence-Divergence (MACD) indicator highlights shifts in the direction of price momentum.
This makes it a useful indicator to time trade entries. This is because long traders are more likely to be successful when momentum is just beginning to turn up. On the flip side, sell signals should work best when momentum first turns negative.
Many common trading websites have MACD tools, and they’re easy to interpret once you know what they are. But we’ll spend a little time talking about the mechanics of MACD and how it’s calculated to give you a better understanding. Once you’re up to speed, you can choose to either tweak the values or simply use it as a quick trade confirmation tool.
Calculating Moving Average Convergence-Divergence (MACD)
To find MACD, we begin with two moving averages. Subtract the value of the longer moving average from the shorter one. Traders often use 12 days as the value of the short moving average and 26 days for the long average.
Instead of using a simple moving average (SMA), MACD generally is calculated with exponential moving averages (EMAs). The EMA is considered to be more responsive than the SMA and often more closely tracks the price action. This is because the EMA uses calculations that overweight the most recent data relative to older data and can respond more rapidly when the trend changes.
(Don’t worry, your brokerage or favorite charting website should feature EMAs. If they don’t, there are plenty of alternatives out there.)
The formula for MACD is:
MACD = 12-day EMA – 26-day EMA
It is almost always used with a signal line, which is a 9-day EMA of the MACD line, or as a histogram, which is found by subtracting the value of the signal line from the MACD.
How Traders Use Moving Average Convergence-Divergence (MACD)
MACD can be used to provide very clear buy and sell signals and help take indecision out of the trading process. For example, the chart below shows the Dow Jones Industrial average with MACD with a signal line (black), EMA (blue) and the MACD histogram (blue bars) in the lower panel. Buy signals occur when the MACD line is above the signal line or when the histogram is greater than zero. The opposite conditions define sell signals.
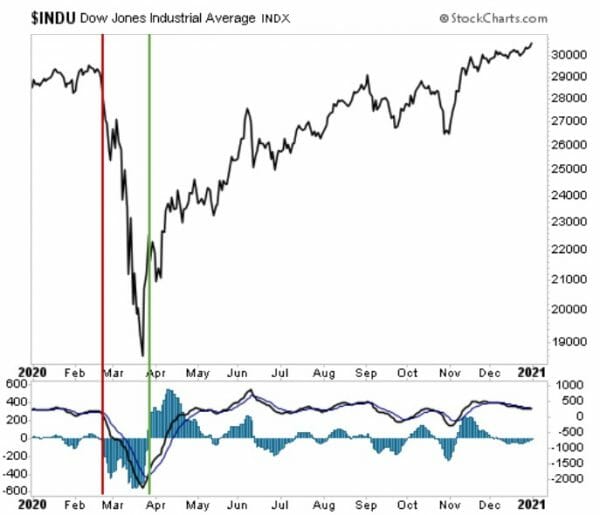
The timing of the signals is the same with either approach. The histogram offers a signal that is easy to spot visually. For this reason, it’s often preferred by many traders. In this example, traders would have received a timely signal to sell (denoted by the red vertical line) before much of the ensuing Covid-19 market selloff. A buy signal (green vertical line) happened very near the market bottom. It’s worth noting, however, that less definitive signals were issued in the following months.
Traders can also use MACD to detect divergences. Many believe that momentum leads price, which means momentum will change direction before price. If prices reach a new high while MACD is declining, that sets up a bearish divergence. In this case, traders will usually expect prices to decline. If MACD is rising as prices fall, that could be a bullish divergence, with prices setting up to turn higher.
Divergences are difficult to interpret. For starters, we recommend looking to price moves confirmed by momentum, meaning that MACD moves in the same direction as the price.
[Related: The MoCS indicator is similar to MACD, and can can help traders stay one step ahead. Learn more here. ]
Closing Thoughts
MACD is simple to interpret and it is an effective indicator by itself. The trade signals are precise, which many traders like. Knowing you will buy or sell when the indicator crosses the zero line helps take emotion out of trading. Emotional reactions to the markets can cause large losses or force traders to abandon winning trades too quickly. With MACD, the trade rules are known in advance.
Since momentum is widely believed to lead prices and MACD is one of the simplest momentum indicators, it is a valuable tool for traders wanting to quickly evaluate the trend in momentum. They can then anticipate price moves based on changes in momentum, which they expect to take place first.
P.S. Looking to retire soon? This might change your plans…
America’s $2.8 trillion dollar “safety net” has a huge problem… Setting millions of retirees up to see a massive 23% “pay cut,” potentially leaving many without enough income to cover the essentials. But that doesn’t have to be YOUR story. That’s why I created a custom blueprint designed to generate up to $35,522 per year in EXTRA retirement income… almost double the table scraps Social Security will toss to us in retirement.