This Indicator Helps Small Traders Profit Along With Big Ones
If you’ve been trading for a while, then you may have noticed several technical indicators among your charting tools that include the term “accumulation/distribution” in their title. All of these indicators attempt to determine if a security is under accumulation or distribution from larger traders.
Accumulation means that large investors are buying a security. When institutions and traders with millions (or even billions) to invest are buying a stock, they could easily drive the price much higher if they bought the security all at once. Instead, these investors usually buy smaller amounts and accumulate a large position over time. Accumulation indicators try to identify when a stock is being bought by large traders.
When they sell, these large investors will follow a similar process. They will break their sell orders into multiple, smaller transactions. The selling is known as distribution.
Two Useful A/D Indicators
Trader and author Larry Williams created the Accumulation/Distribution Indicator. This is a cumulative sum of market activity in any security using the true range indicator. When a stock’s price closes higher, the AD Indicator is equal to the sum of the prior day’s AD indicator and the value of the close minus the true low for the day. (The true low is the lower of the day’s low and prior day’s close.)
Down days use the true high in the calculation and subtract the true high from the close. That value is then added to the previous value of the AD Indicator. The true high is the greater of today’s high or the prior day’s close. Unchanged days have no impact on the AD indicator.
Marc Chaikin developed the Accumulation/Distribution Line, which is similar to On-Balance Volume (OBV). The AD Line is the cumulative sum of the product of the Intraday Intensity Index (III) and volume. The formula is:
AD Line = AD Line (prior day) + III where III = (2*close-high-low) / ((high-low) * volume)
Williams’ AD Indicator does not use volume in its calculation. This means it can be applied to mutual funds, in addition to stocks, ETFs, and futures. Chaikin’s AD Line requires volume data and can only be applied to stocks, ETFs or futures.
How Traders Use It
Both the AD Line and the AD Indicator are used to confirm trends and spot divergences. If the price is setting a new high while the indicator is making a lower high, traders could interpret that as a bearish divergence. That’s considered to be a sell signal.
That’s exactly what happened in January 2022. Our colleague Jimmy Butts told readers that one of his “favorite indicators of market health” (the AD Line) was warning about weakness in the market.
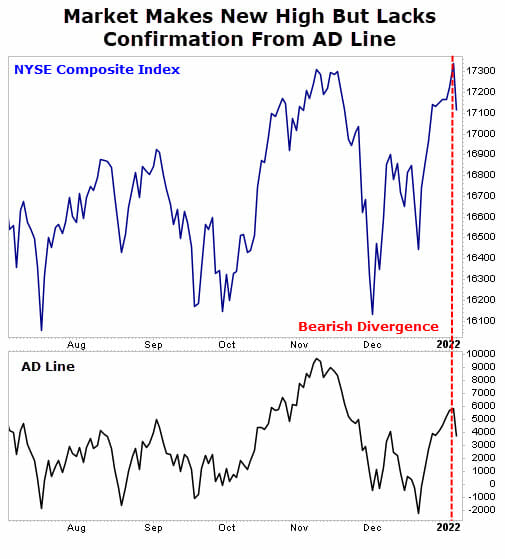
The market fell into a significant correction in the ensuing weeks.

A lower low in price with a higher low in the indicator would be a buy signal.
Both the AD Line and AD Indicator can be used for individual stocks as well. However, we are fans of using these indicators for broader market analysis.
Why It Matters To Traders
Both indicators are usually equally effective. It’s just a matter of using the one you’re most comfortable with.
Traders can also scan a list of all traded stocks for the greatest percentage change in either indicator over the past few weeks or days. This will allow you to spot stocks that are likely the target of institutional buying or selling.
Bottom line, AD indicators are designed to show what the largest investors in the market are doing. Over time, the largest investors should be more successful than smaller investors. AD indicators are therefore expected to track the actions of the large investors and highlight opportunities for smaller traders to benefit from the extensive research capabilities of larger traders.
P.S. During this period of uncertainty, you should diversify your portfolio with safe-haven assets such as government bonds or gold.
You should also consider cryptocurrency. That’s right… crypto.
Crypto is making ordinary investors rich… and it also serves as a hedge against geopolitical risks. The price movements of cryptocurrencies are less vulnerable to overseas turmoil. Bitcoin (BTC), for example, is similar to gold in that it may be used as a store of value and a hedge against economic volatility.
But you need to make your move now because the fuse is lit on this market. And every day you wait is literally costing you thousands in profits.
If you’re worried you can’t figure out crypto… don’t be.
Our in-house crypto expert, Alex Benfield, will make it easy for you. He’ll walk you through everything, step by step.
Get in on the crypto action… now. To learn more about Alex’s new trading service, Crypto Trend Investor, click here.