[Video] Who’s Winning, Bulls Or Bears? Use This Indicator To Find Out…
Want to know whether a stock is really “trending”? There are a few ways to know for sure, and one of them is the Directional Movement Index (DMI).
Hey folks, it’s Brad here with StreetAuthority. In this video, I’m going to show you how this popular tool can help lead you to winning trades…
But before you pull up your favorite trading software and begin using it, there are a few things you need to know.
For a more thorough explanation, you can also read the complete article below this video. (As always, if you like this video, please give us a like and a follow. And as always, if you have any questions or comments, drop me a line.)
Let’s dig in…
What is Directional Movement Index (DMI)?
In general terms, DMI is positive when the difference between today’s high and yesterday’s high is greater than the difference between the two lows. It is negative when the difference between the lows exceeds the difference between the highs.
These moves are tracked for the last 14 days and summed together. If DMI is positive for a day, then –DI is equal to zero. On days when DMI is negative, +DI will be zero.
Calculating DMI involves many steps, but it can be found on many websites and trading software (although they may use different terms.)
DMI is a required input for the Average Directional Index (ADX) indicator. (This is a popular indicator we covered in this article.) The Positive Directional Index (+DI) and the Negative Direction Index (-DI) are found separately and then used to calculate ADX. Or the two indicators can be used as a standalone trading strategy.
These tools were introduced in J. Welles Wilder’s 1978 book, New Concepts in Technical Trading Systems. Wilder pioneered many technical indicators that are still in use today (other tools from Wilder include RSI, ADX, and ATR, to name a few). In this case, Wilder was trying to identify whether bulls or bears had more conviction. He used the size of the trading range as evidence of that. He assumed the larger move represented the direction of the trend.
How Traders Use Directional Movement Index (DMI)
As mentioned, values for DMI are needed to calculate ADX. But they can also be charted separately and used as a trading strategy, which we have shown in the chart below.
The chart shows the price action of the iShares Silver Trust (NYSE: SLV) ETF over two years. Traders would be long when +DI (green) is greater than –DI (red) in the bottom panel of the chart.
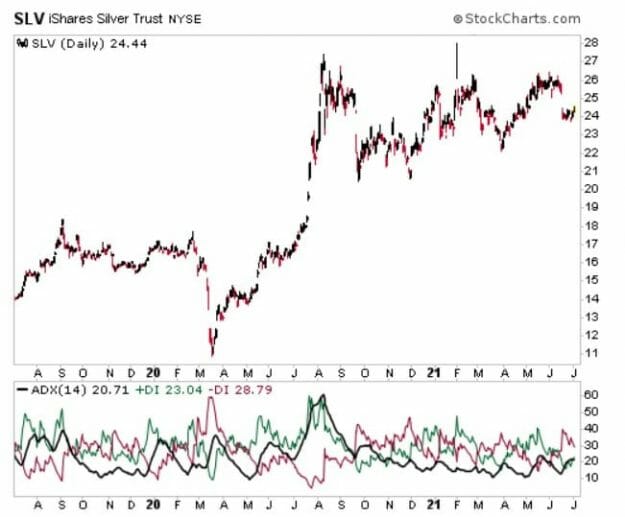
Several trading opportunities are shown here, most notably from March through late September 2020. This included a period where SLV ran from about $14 all the way up to $27. But by the time the red crosses over (the sell signal), SLV fell back to $22.
One thing to note, though, is that there can be times when the two indicators rapidly cross each other. This would lead to a large number of small trades. To avoid that, traders can apply a trend filter like ADX, which we have also included in the bottom panel. Signals would then only be taken, for example, when ADX is above 25 (indicating that a market is trending).
Why It Matters To Traders
DMI offers traders a simple and logical trading strategy, which traders can use for a clearly defined rules-based trading system.
Although the rules are clear and easy to interpret, the system sometimes suffers from an excessive number of crossover signals. This is where it becomes wise to not rely on one indicator alone. However, combined with other trading tools, like ADX or moving averages, DMI can provide valuable input in a trading system.
P.S. Want to learn about 12 ultra-generous dividend payers that will put more money in your pocket each month?