This Is One Of The Oldest Chart Patterns Around — And It Still Works…
When traders start exploring technical analysis, they begin to learn all manner of terms and patterns. Some have been around for decades (or longer), while others are relatively new. Take the Head and Shoulders Top pattern for example.
This is one of the best-known patterns in technical analysis. It was first written about in 1930 by a financial editor at Forbes magazine that described how the Head and Shoulders (H&S) forms and how it can be traded.
But does this old chart pattern work? By looking at what it is and how traders have used it, we’ll see if it has any merit for traders in today’s market.
What Is The Head and Shoulders Top Pattern?
Many traders are familiar with the Head and Shoulders Top pattern. On a price chart, there will be three peaks in price at the end of the uptrend. The center peak (the head) is higher than the other two. The peaks on the sides (the shoulders) should be about equal in height.
Connecting the bottom of the peaks gives us the neckline. When the price breaks the neckline, it’s a sell signal.
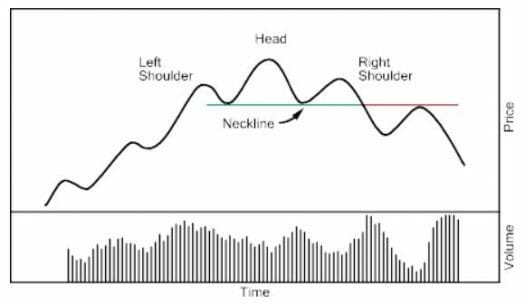
Source: Stockcharts.com
Many traders also watch the volume pattern and require a peak on the left shoulder, a lower peak at the head, and then an even lower level at the right shoulder. One simple technique to determine whether the pattern fits is to draw a downtrend line on the volume chart. If the price pattern and volume line match, then you have identified a head and shoulders formation.
The head-and-shoulders pattern is a major reversal formation. Typically, it takes at least two to three months to complete — and sometimes much longer. When a stock breaks below the neckline, there is no longer any support and very rapid declines can occur, often on increasing volume.
How Traders Use Head and Shoulders Top Patterns
The first study on the Head and Shoulders pattern was done by economists at the Federal Reserve Bank of New York. The researchers wrote:
“Though such visual, nonlinear chart patterns are applied frequently by technical analysts, our paper is one of the first to evaluate the predictive power of such patterns… We identify head-and-shoulders patterns using an objective, computer-implemented algorithm.”
The results show “profits would have been both statistically and economically significant.”
Studies like this show us that old ideas can be valuable in the market when those ideas are defined precisely and followed with a disciplined approach. The problem is that real Head and Shoulders patterns rarely resemble the precise line diagrams seen in books. The chart below shows one that occurred in real market conditions. The shoulders are nearly, but not quite, the same height.

A confirmed Head and Shoulders Top formation can offer a shorting opportunity. On the other hand, it can also provide an early warning sign for those with long positions to sell quickly. That’s the case with the chart above. As 2022 began, markets sold off sharply — and by May, a clear sell signal had developed when the S&P 500 dropped below the neckline.
Why The Head and Shoulders Top Matters To Traders
As mentioned, the H&S top formation is one of the most common technical chart patterns. As a “reversal formation,” it requires an uptrend to first occur, then a major trend reversal. When this happens, it essentially means that traders are willing to sell the stock at lower prices than before. And this is a good signal to get out of what is likely to be a losing trade going forward.
The problem with charts is that their interpretation is subjective. Many traders find a Head and Shoulders in almost every chart they look at because some traders tend to see what they want to see. So results can vary.
We have found that successful trades like this can be found by using a disciplined approach. The Head and Shoulders Top pattern can be traded using only charts, but many traders would be better served by defining the pattern in a software package to help avoid buying and selling based on what they think they see.
The same is true for any trading tool. Some of the best ideas for traders have worked for decades. Those tools can now be applied consistently and objectively with automated processes that should increase profits.
P.S. If technical analysis isn’t your thing and you’re looking for long-term wealth builders, then check this out…
If you’re tired of the measly sub-2% yields offered by the average S&P 500 stock, then you need to get your hands on our Monthly Money-Makers report. We’ve found over a dozen yields of 6%, 8%, and even 11% from securities you won’t hear about anywhere else — and best of all, they pay monthly! Go here to learn more now.