This Chart Shows How Rare The Market Drop Is
The current market environment is unprecedented.
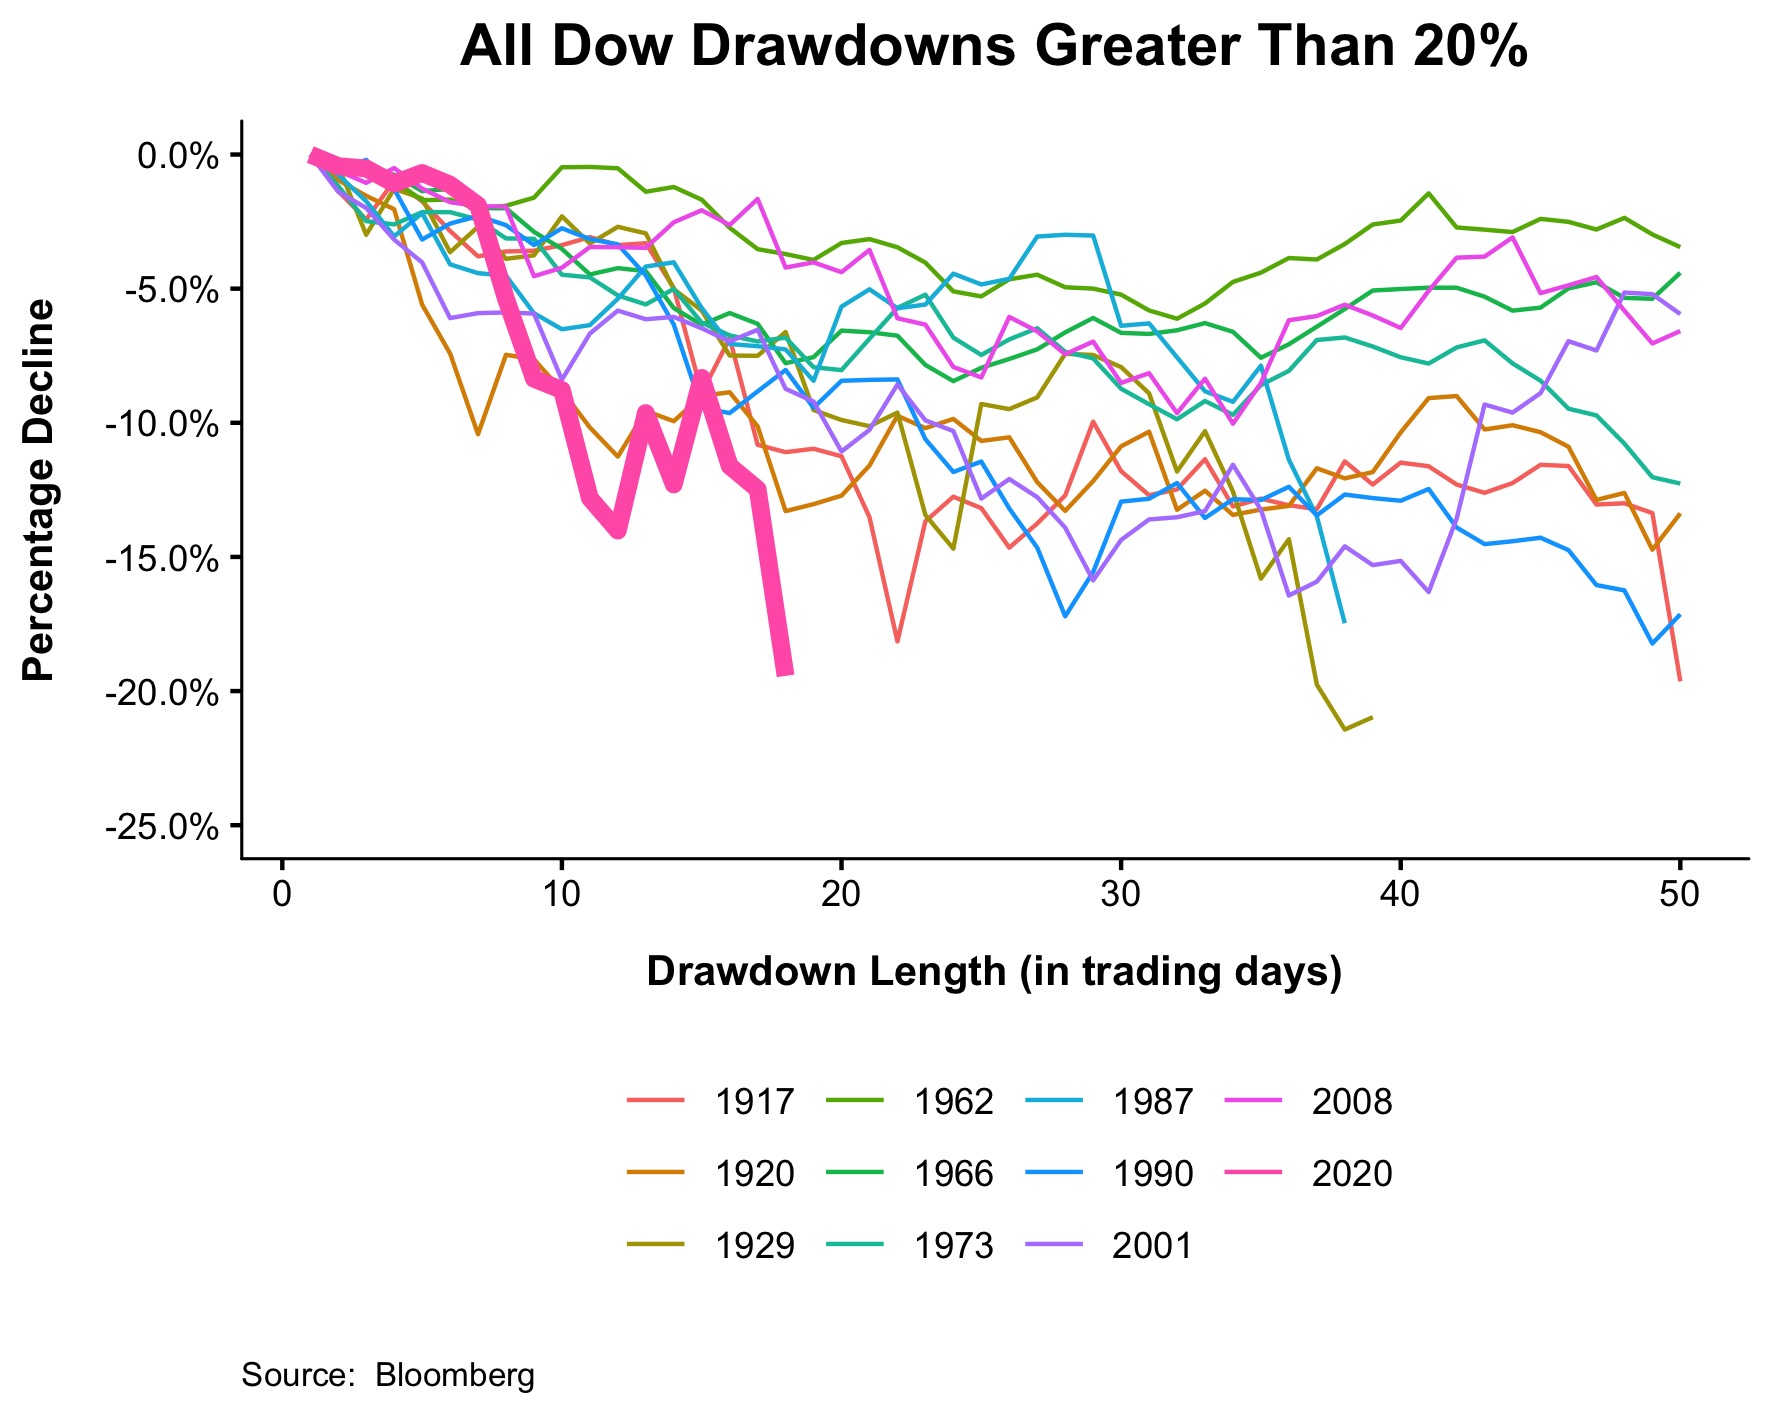
The chart below shows all declines of 20% or more from the all-time high going back to 1915.

Source: theirrelevantinvestor.com
On average, it takes 255 days to go from the all-time high to the official start of a bear market, which is defined as a 20% decline. The median, a better measure of the middle of the data, is 156 days.
On an intraday basis, it takes 17 sessions for the Dow to drop 20%. The second fastest fall from high to bear was 1929, which took 36 sessions. In 1987, the crash came 38 days after the high.
The speed of the decline is important to consider. It’s a rare event, and we need to develop our investment strategies for the normal environment.
That means when a rare event occurs, like the recent decline or the incredible rally that followed the bottom in March 2009, we will be forced to react. That’s important to remember because if we are always positioned for the rare event, we will be unable to benefit from normal conditions.
Normal conditions will return to the market. But for now, fear remains high and concerns of a recession are rising. In this way, nothing has changed since last week.
Actually, there has been a deterioration in the market since last week. Last week, I noted that 84% of stocks in the S&P 500 are in corrections, meaning they are at least 10% below their 52-week high. This week, that’s up to 94%. And 67% are in bear markets, falling at least 20% below their highs.
Action To Take
If you remember, yesterday I said: “My initial target for the S&P 500’s bear market is 2,375, a 30% decline. It could ultimately go even lower. We will most likely see short-term rallies along the way down, but we may also get there fairly quickly.”
The point is, eventually stocks will stop falling. And I will find plenty of suitable trades when the time comes. I’ll continue monitoring the market. When there are significant opportunities, I will send a recommendation that meets my requirements for safety. You should be ready, too.
Editor’s Note: If you’re looking for money-making advice that can weather any storm, then turn to my colleague Jim Fink.
As the chief investment strategist of Velocity Trader, Jim has perfected a trading system that reaps profits in up or down markets… even when the markets are a roller coaster like they’ve been here lately.
In an upcoming free event, Jim Fink will explain how his scientific investing system pinpoints stock movements as small as 1%, before they happen, and then leverages those movements for whopping gains.
Jim already has used his system to deliver 20,747% profits to a small group of readers in less than five years.
To learn Jim’s secrets, I encourage you to secure your place on this special event. But you’d better act now. Spots are limited and they’re going fast. Click here to sign up.