My “All Clear” Indicator For The Market Just Reversed Signals…
I was listening to a podcast the other day and couldn’t believe what I heard…
The host, co-host, and guest were discussing where they invested their money. Now, this wasn’t a podcast on stocks or finance. It was more of an entrepreneurial podcast. But the topic of investing crept into the conversation.
I assumed all three would have a similar answer as the one the guest provided — a steady dose of low-cost index funds and emerging market funds. After all, all three people were under 35 years old.
But the host said something completely different… something that caught me by surprise.
He had sold all of his stocks…
Mind you this host has done quite well for himself, having built five different businesses that all do $1 million-plus in revenue. And being 34 years old, traditional finance says you should be heavily allocated towards equities.
But not this young gentleman. More than 80% of his portfolio is sitting in cash.
Again, we are talking about a young 30-something-year-old guy that was terrified of the market’s volatility. He didn’t want to lose any more money, so he simply sold everything… For peace of mind.
Have Investors Thrown In The Towel?
Now, before I go further, some of you may know that we briefly rotated into cash over at my premium Maximum Profit service. But that’s because we are a trading service. And because we were heavily allocated to the energy sector, and oil prices dipped, our system signaled that it was time to get out.
Maybe he reads the newsletter and that’s why he sold. But I doubt it. Besides, we didn’t stay in cash for long. we’re not long-term “buy-and-hold” investors, and part of our strategy is to get in and out of stocks by pulling profits and keeping our losses small. It’s certainly not a strategy that most folks, especially one who runs over five businesses, have the time for. Most people simply sock away their cash in an ETF or mutual fund and leave it at that.
Here’s why I bring this up…
When you begin hearing of folks, especially young people, who have essentially thrown in the towel on stocks, well, that’s music to my ears.
Yes, I know that one person on a podcast is an anecdote and not data. But this exact sentiment is popping up more and more. And not only conversations, but you can also see the concern in multiple consumer confidence surveys.
For example, the University of Michigan consumer sentiment for the U.S. hit a record low of 50 in June and barely inched up to 51 in July.
Then there’s a separate survey — the US Consumer Confidence Survey. This details consumer expectation for inflation, stock prices, and interest rates. It also decreased in June, following a decline in May.

You see, when all hope is lost and people are waving the white flag, that’s typically a great signal that the worst is behind us. Investors get fed up with seeing losses pile up in their accounts and they turn from “buy-and-hold” investors to “buy-and-fold” investors.
Light At The End Of The Tunnel
I can’t predict the future any better than the next guy. But I’m beginning to see light at the end of the tunnel, signaling that just maybe we are nearing a bottom in the market.
On July 19, 498 of the S&P 500 names were higher. That’s the largest number of advancers since December 26, 2018. And for anyone keeping track at home that was the bottom of the near 20% pullback that happened in 2018.
The S&P 500 ripped off a nice 25% return in the four months following December 26, 2018.
It’s also only the 8th time since 1996 that 495-plus S&P 500 stocks jumped higher on the same day.
Jason Goepfert, the founder of SentimenTrader, noted that the S&P 500 has never lost ground over the following year when the advancing volume was 87% or more of total volume for two out of three days coming off a 52-week low.
Here’s the chart he posted (the red dots indicate each time in the past this has happened):

Finally, let’s turn to one of my favorite indicators. It has reliably provided an “all clear” signal for when it’s best to get back into the market.
I referring to the Coppock Curve.
I’ve written about this indicator many times. But as a quick refresher, the Coppock Curve is a momentum indicator that measures the market’s “emotional state.” It has consistently identified market bottoms. Once the Coppock Curve drops to “0”, the next upward reversal almost always signals a buying opportunity and the start of an uptrend.
As you can see in the chart below, the Coppock Curve dipped below zero in February. The market has been trending down ever since.
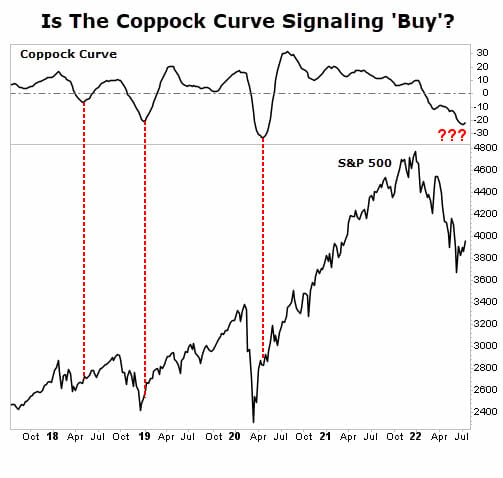
While it’s still early, the Coppock Curve is showing a slight uptick. This could be a head fake. So, a little more time is needed to ensure this is a true reversal.
But if it is… it could be the end of the bear market.
We will remain patient and disciplined before we make a full plunge back into the market. But I’m cautiously wading back into the market, and you may want to consider doing the same.
P.S. If you wished you had invested in cryptocurrencies during the previous run, then listen up…
A rare second-chance opportunity is setting up right now, but only a select few cryptos will be the winners.
That’s why I just released a brand new report covering the world of crypto investing. I’ll explain how cryptocurrency works, what it means for the future, how you can participate, the three best crypto investments available right now – and how you can profit…
If you’re ready to cash in on crypto’s comeback, go here to get all the details now.