This Reliable Technical Sign Says The Market Is Heading Down
Technical analysis. For some, it’s witchcraft. For others, it’s the holy grail.
While the divide between these two camps has softened over the years, you’ll still find strong opinions one way or another.
But I’m not here today to convince you why you should (or shouldn’t) rely on lines drawn on stock charts. Here’s what you do need to know… technical analysis is important. But not for reasons you might think.
More Than Lines On A Chart…
It should be apparent by now that markets are largely driven by the fickle behavior of humans and algos. (Revisit the recent banking crisis for a reminder, which I discussed in March.)
Technical analysis attempts to use squiggly lines on charts to identify where these human emotions could really come into play.
For instance, the 200-day moving average is one of the most widely used technical indicators in stock trading. In August 2022, I pointed out that investors (of all types) should closely monitor the 200-day moving average.
The S&P 500 fell below its 200-day moving average at the beginning of 2022. After that, every time the market rallied, it died at the 200-day moving average. Nearly on the spot. As if it was some invisible force field that the market couldn’t penetrate.
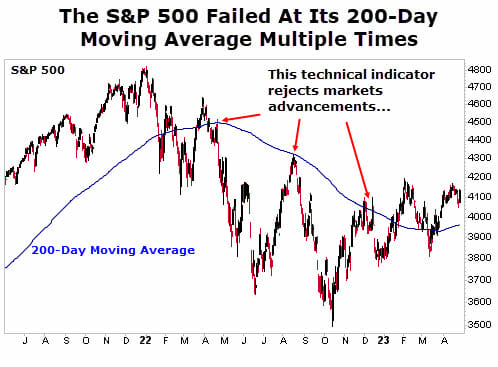
This isn’t isolated to 2022, either. It’s happened repeatedly throughout history, which is why investors closely watch this technical indicator.
Okay, that was a long-winded way of saying that technical analysis has its value. It helps us visually see where the market could be going and potential battlegrounds along the way.
My point? There’s another pattern that’s worth monitoring right now… It’s one I haven’t discussed much (and I’ve touched on a variety of technical patterns and indicators).
A Pattern Worth Watching
That’s the “head and shoulders” pattern. More specifically, a head-and-shoulders top formation.
This is a three-bump formation with the center bump taller than the others. In other words, a stock or index will rally, then pull back. This forms the left shoulder.
It rallies even higher, then pulls back again. This center bump forms the head. One final rally ensues, which typically ends around the same area as the first (or left shoulder). This forms a third bump, or the right shoulder.
Once that right shoulder forms, the stock or index is expected to pull back, and a bigger drawdown is on the horizon.
Here’s an example from my giant book of chart patterns…
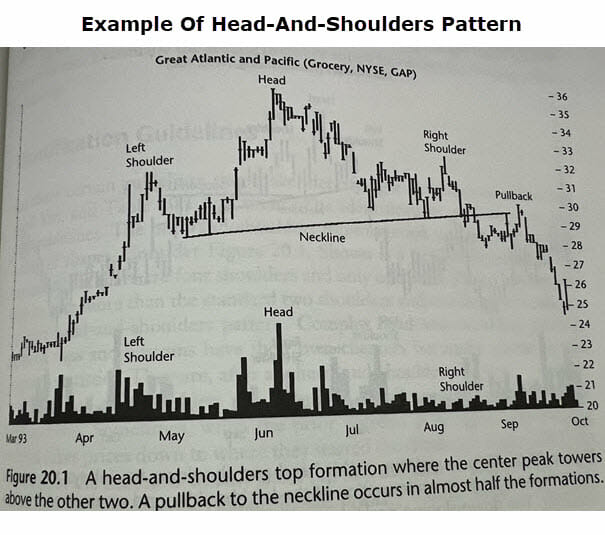
The reason this formation is so popular is because of its reliability. A pullback to its neckline occurs nearly half the time. Even more astonishing is that 93% of the formations break out to the downside and continue to move down.
Here’s the head-and-shoulders formation that the NYSE Composite Index is beginning to show…
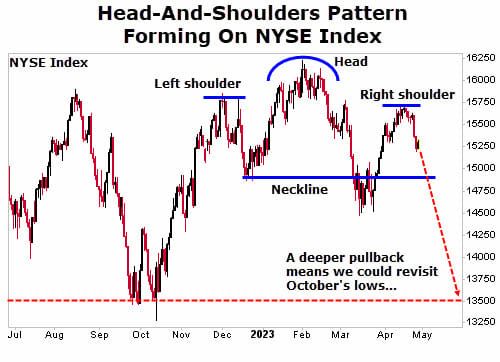
In other words, there’s a good chance that we will at least revisit the lows we saw last December. And there’s a good chance stocks could fall even further to the October 2022 lows. That would be a fall of about 12% from here.
How This Affects Us
We’re already seeing early fallout. Over at Maximum Profit, for example, we have trimmed our portfolio significantly as a result of our sell signals. I will closely watch our remaining holdings to see if they hold up should markets drift south.
But remember, this formation has a 93% chance of breaking out to the downside. The odds are not in our favor. Of course, this index is composed of more than 2,000 stocks, and not every stock has to go down.
However, we do want to remain especially diligent with our trades. The overall market environment suggests we have more downside ahead.
P.S. It’s the biggest lie America has EVER been sold… And it’s about to destroy the retirement dreams of tens of millions.
America’s $2.8 trillion dollar “safety net” has a huge problem… And if Washington doesn’t act soon, it could set some retirees up to see a massive 23% “pay cut”. But that doesn’t have to be YOUR story…
That’s why my colleague Nathan Slaughter created a custom blueprint designed to generate up to $35,522 per year in EXTRA retirement income. That’s almost double the table scraps Social Security will toss to us in retirement. Go here to learn more…