Checking Back In On A Reliable Technical Indicator…
A couple of weeks ago, I told you about the head-and-shoulders pattern forming in the broader market. More specifically a head-and-shoulders top formation on the NYSE Composite Index.
I want to circle back to this in a moment. But first, let’s recap a little bit of what’s happened in the big picture with the market recently.
What’s Happened In The Market
There’s been a lot of noise news in the last couple of weeks.
- We have the debt ceiling quandary going on over at Capitol Hill.
- Last week the Federal Reserve hiked the benchmark rate by a quarter percentage point. It’s now in the 5% to 5.25% range, the highest since August 2007.
- Oil prices plunged, dipping below $70 a barrel on demand fears (prices are hovering around that $70 mark.
- Gold remains strong above $2,000 an ounce (good for our gold miners).
- And finally, we had more turmoil in regional banks.
It’s that last bullet point that I want to expand on…
If you hadn’t heard, the banking crisis is still going on in the background. Shares of PacWest (Nasdaq: PACW) and Western Alliance Bancorp (NYSE: WAL) were halted multiple times last week.
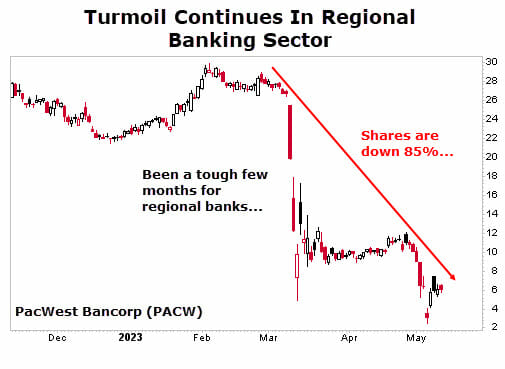
Traders were spooked by doubts over regional banks, recession risks and a potential US debt default. It didn’t help that former Federal Reserve Bank of Dallas President Robert Kaplan said the US regional banking crisis is far from over.
Revisiting The Head-And-Shoulders Pattern
Now, for a refresher on the head and shoulders pattern, here’s what I said back then:
This is a three-bump formation with the center bump taller than the others. In other words, a stock or index will rally, then pull back. This forms the left shoulder.
It rallies even higher, then pulls back again. This center bump forms the head. One final rally ensues, which typically ends around the same area as the first (or left shoulder). This forms a third bump, or the right shoulder.
Once that right shoulder forms, the stock or index is expected to pull back, and a bigger drawdown is on the horizon.
I also mentioned that a pullback to the “neckline” was nearly imminent. 93% of these formations break out to the downside and continue to move down.
With that sort of success rate, I figured it is worth revisiting. I also want to provide a reminder of what might lie ahead and remain attentive to that.
So here’s where we are at today…

As you can see not much has changed. There’s been a bit of movement in the index, but after two weeks the index is almost exactly in the same spot.
I did want to point out one thing that I failed to mention in the last article… and that’s when this formation is essentially “void.” As in it failed to deliver…
If the NYSE climbs past its highs of its “right” shoulder (around the 15,700 mark) that would nullify this formation.
Action To Take
If that happens, I will look to my two other trusty indicators — the Advance-Decline line and Coppock Curve — to help me decide when to pile back into the market. Neither are providing a bullish signal right now.
If you want a refresher on those indicators, you can scan through our archives. But the bottom line is that we need to remain cautious.
In the meantime, I just released a new briefing about cryptocurrencies — and how you can profit…
My team and I think cryptocurrencies will surge again in the coming months. That’s because three “blue chip” cryptocurrencies are getting major upgrades this year, and they could unleash a massive crypto boom…
This could easily be a once-in-a-lifetime chance to take a small amount and turn it into a life-changing gain. Sounds unbelievable, I know… but the numbers don’t lie. Get the details here…