Facebook’s Terrible Week… Why It’s Still A ‘Buy’… And The “All Clear” Signal For The Market…
This is just not Facebook’s week.
On Tuesday morning, a former project manager at the company turned whistleblower sat down with Congress to give her testimony.
Among her accusations are that the social media giant puts “profits over people” by allowing and/or enabling misinformation and division. What’s more, she alleges that the company actively promotes to children despite knowing the deleterious effects of social media on young people, especially young women.
“The documents Haugen released unearthed several explosive revelations about the company’s tactics in the pursuit of growth, including bids to market its products directly to children, documents underscoring the severity of the platform’s public health misinformation crisis and internal research that found its Instagram platform is destructive to young girls’ mental health.”
As if that weren’t bad enough, then the company’s entire suite of apps went offline for about six hours – Facebook, WhatsApp, Messenger, Instagram, Occulus, you name it. The culprit, according to the company, was an issue with the “backbone routers that coordinate network traffic between our data centers caused issues that interrupted this communication.”
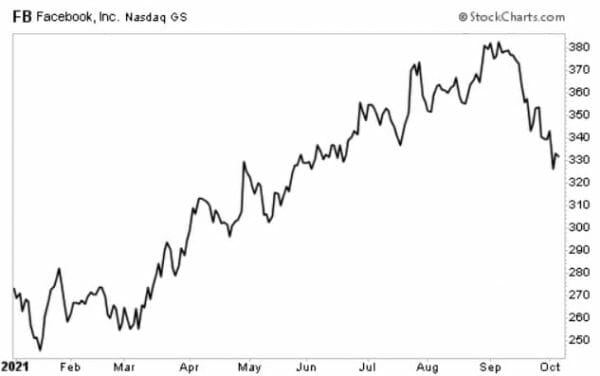
Shares of FB fell 5% on Tuesday, and are down about 12% from their previous high in early September.
Now, I’m not savvy enough to fully understand what happened with the outage. And I’m not plugged into Washington, so I don’t know whether these hearings will actually lead to anything. But seeing as how Congress can barely get anything done, my guess is no.
There’s a lot of talk about Facebook being the next “Big Tobacco”. The implication is that you have a giant company, actively harming the public, knowing about it, and lying about it.
While my personal take is a little more nuanced than that, I’ll stay out of such arguments. Our job, after all, is to point you to opportunities to profit.
So here’s what I do know…
Facebook is giant. Its reach is undeniable. In the graphic below, you can see the latest available information on how many people use each of Facebook’s apps.
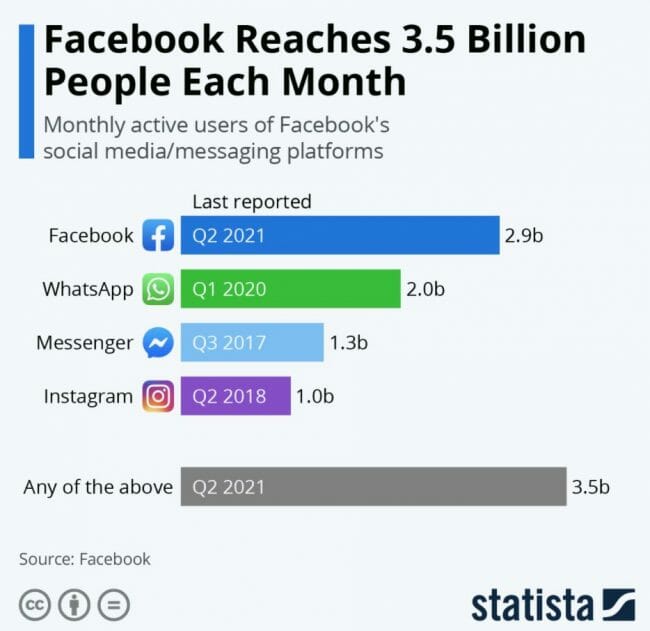
Source: Statista
Here’s what I also know…
As my colleague Jimmy Butts, Chief Strategist of Top Stock Adviser, likes to say, Facebook is a “no brainer” stock. Yet many investors seem to write it off, thinking that there isn’t any growth happening, or that they simply missed their chance.
Here’s what he had to say the last time he updated his subscribers on the company’s Q2 numbers:
“When we talk about the large tech companies on the market, we often end up talking about these large sales numbers so much that we can become numb to just how impressive they are. It’s not easy for a trillion-dollar company to really move the sales needle. Yet, Facebook continues to do so.
The company is on pace to generate more than $118 billion in sales this year, which would represent a 37% increase from the $86 billion it made in 2020.
For its second quarter, Facebook pulled in more than $29 billion in revenue with earnings per share of $3.61. Both topped analyst expectations.
Facebook’s $29 billion in quarterly revenue was a staggering 55.6% increase over the same period a year ago. It also pulled in more than $13.2 billion in cash flow, giving it a cash flow return on invested capital of 36.5%.”
Since adding Facebook to the Top Stock Advisor portfolio in 2016, the stock has delivered our premium subscribers a massive 180% return. That handily beats the S&P’s 106%.
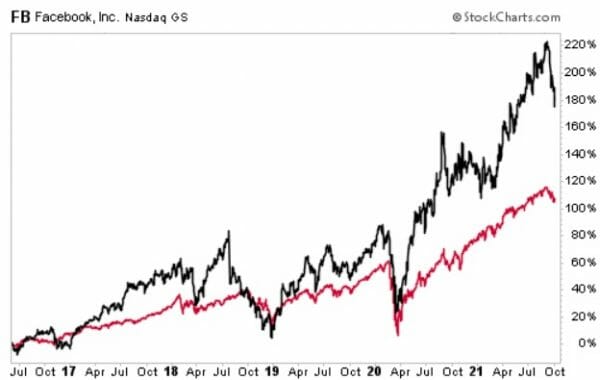
Just look at how much of that has come in the last couple of years. It’s remarkable. Yet every time Facebook comes under scrutiny, it gets discarded. But it usually ends up being a buying opportunity. And by the way, when the company publishes Q3 results on Monday, October 25th, you can probably expect more of the same… blow-out numbers.
As I write this, Jimmy is already updating his Top Stock Advisor readers on the situation with Facebook. But I’ve already confirmed the gist of what he’s going to say.
As Jimmy told me, “Yup, still a buy.”
Editor’s Note: For Jimmy’s latest research, you can go here.
I want to turn the rest of today’s issue over to Jimmy, who’s been carefully monitoring one of his favorite indicators for weeks. It told him and his readers to be cautious about the market before this most recent bout of volatility. And now, he’s turning to another one of his favorites for an “all clear” signal…
Introducing: My “All Clear” Signal To Dive Back Into The Market
 For the past couple of weeks, I’ve been telling readers about one of my favorite indicators. In short, it tells us about the health of the market at any given time.
As I mentioned before, this indicator has served us well over the years. And so far, it’s looking like it’s doing its job again – by warning us of the recent volatility we’ve been experiencing in the market ahead of time.
The most recent time we took a look at this indicator, I gave a warning about letting your ego get in the way of trading. But there’s nothing wrong with giving ourselves a little pat on the back before getting back to the serious business of analyzing the market with a degree of detached objectivity.
Okay, so with that being said, let’s get down to the nitty-gritty. What’s going on in the markets… what is my breadth indicator showing… and how will we know that it’s “all clear” to get back in…
The markets saw a big selloff on Monday, September 20th, then it rebounded nicely to finish that week in the green. Last week we retested those lows, and the market continued to show a lot of volatility.
Then, once again, we started this week on the wrong foot. Monday looked like it might be the day the bottom fell out, but then yesterday we had an impressive rebound.
The market hasn’t marched to its high set at the beginning of the month (September 2), so my breadth indicator — AD Line — is still showing weakness in the market.
What The AD Line Is Saying Now
Now if you haven’t been following along, let’s recap what this is…
The AD line is what’s known as a breadth indicator. When the market is rallying, ideally you want to see a large number of stocks that are reaching new highs. This means that the bull market is healthy, and it confirms the bullish trend.
However, if the AD Line fails to keep pace with the underlying index, this is a sign of weakness. It’s what market technicians call a bearish divergence. This is exactly what happened – twice – which caused me to warn that we may see a pullback in the market very soon.
That’s exactly what happened. So here’s the updated AD Line…
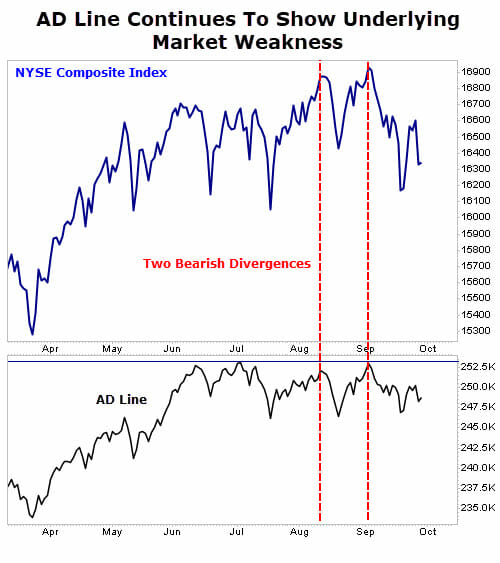
As you can see, not much has changed in the last two weeks. While you could describe this as a “pullback,” we’re not in full-blown “correction” territory. At least not yet.
I continue to remain cautiously optimistic — and I am actively recommending trades for my premium subscribers. We have plenty of cash on hand in our hypothetical portfolios.
Generally speaking, this can be a difficult environment to trade in, but once I get the “green light” from my “investor sentiment” indicator, we will dive right back into the market headfirst.
This Little-Known Indicator Will Give Us The “Green Light”
I’ve touched on this indicator a couple of times. I first introduced it to our non-premium readers here. And then again, in early March of last year, I showed how it was flashing an opportunity to get back in the market and buy.
The indicator I’m referring to is the Coppock Curve, which is a momentum indicator that measures the market’s “emotional state.”
While some may use it as a sell signal, its real value comes at identifying market bottoms (it’s usually too early to signal market tops). Understanding the prime buying opportunities with this indicator is rather simple. Once it drops to “0”, the next upward reversal almost always signals a buying opportunity and the start of an uptrend. As you can see in the chart below, it has identified every significant buying opportunity over the last decade.
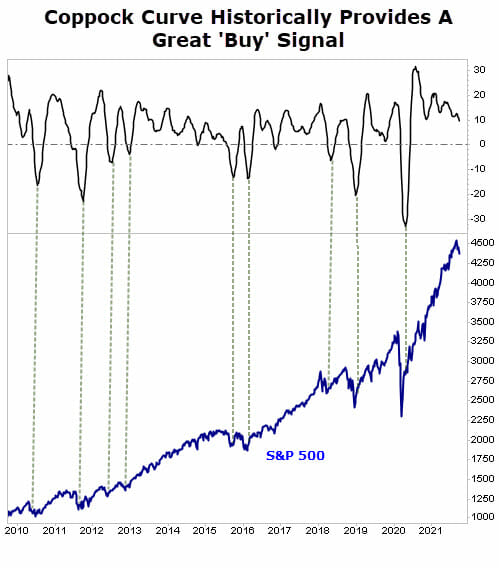
Right now — much like the breadth indicator — the Coppock Curve is still wary of the market’s emotional state. It hasn’t dropped to drop to zero yet, though. But it’s clearly working its way down.
Action To Take
I’m going to watch this closely in the weeks ahead, especially if the market trends further downward. Should the Coppock Curve drop below zero then make its infamous U-turn, that will be my green light that a new uptrend is taking place.
If and when that happens, I will then confirm the uptrend with the AD Line. Then, I’ll move from slowly adding positions to my premium portfolios to diving headfirst into buying.
As a side note, when the trend does turn more bullish, I anticipate small- and mid-sized companies to surge first. So that’s where I’d focus my efforts.
P.S. I just released a report about Elon Musk’s latest venture — and how a “backdoor” way to invest could make early investors a killing…
If you haven’t heard of Starlink yet, you soon will. That’s because after extensive beta testing, the billionaire entrepreneur is about to go “live” with the service soon. But even though Starlink is “off limits” to regular investors, we’ve uncovered a “silent partner” that gets you in on the ground floor… lightyears ahead of other investors.